Flexible, custom dashboard system developed for government green energy monitoring
– Oct 17, 2024
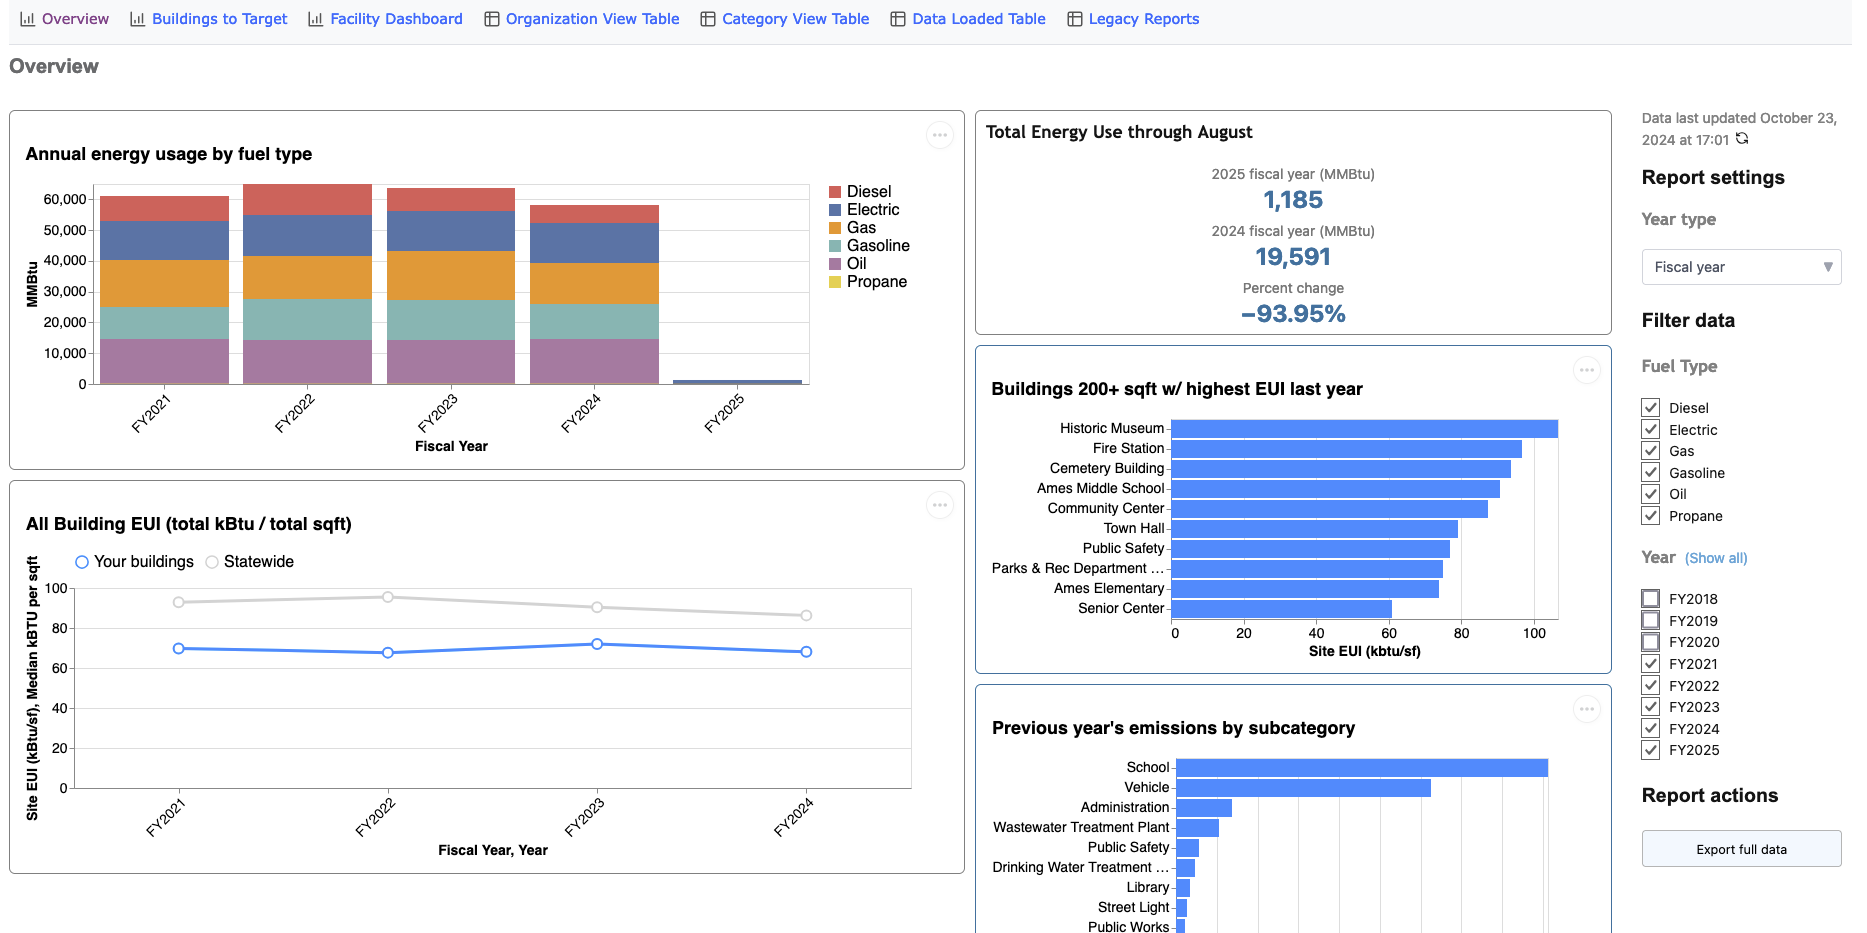
Optimiser is contracted by the state of Massachussetts to create dashboards that allow state officials to monitor energy usage for government buildings and infrastructure. Optimiser came to me looking to replace a set of legacy Tableau dashboards with a custom, in-house solution.
I designed and developed a fully custom, interactive, and highly flexible dashboard system in JavaScript, using D3.js and vega-lite. I worked closely with Optimiser to design dashboards that give users the data and insights they needed as clearly as possible, and to develop a system that is customizable, responsive, and future-proof.

Outcome
- Much more effective data communication: The original system contained many redundant and confusing dashboards and tables. Users did not know where to find the information they wanted. After extensive interviews with many different types of users, I along with the Optimiser team developed much more streamlined visualizations, dashboards, and tables, bringing 20+ separate pages down to just a few, each organized around a clear purpose and communicating even more data than before.
- Vast performance improvements: The Tableau system was very slow on both initial data load and interacting with the data. The new system initial load is significantly reduced and data interaction is instant.
- Flexible, future-proof system: My solution allows Optimiser to declare complex, feature-rich dashboards using JSON. With only a JSON config file and no additional code, they can create interactive dashboards to display data in different ways and for different client needs.
- High code standards: Self-contained, unit-tested custom JavaScript solution that communicates directly with Optimiser's database and has no dependency on the client's other front-end code.
- Further notable features:
- Ability to use the full capabilities of vega-lite in dashboards, allowing for a vast array of visualization options
- Highly customizable and performant pivot table system allowing users to do dynamic, on-the-fly aggregation
- Declare any number of filters for any fields present in the data, which can then be applied instantly by users
- Improved navigation between dashboards and reports
- Dynamic URLs that capture the current state of dashboard filters and settings, allowing users to share specific views
- Export current view of data or raw data as CSV for further analysis
- Export charts as images
In action
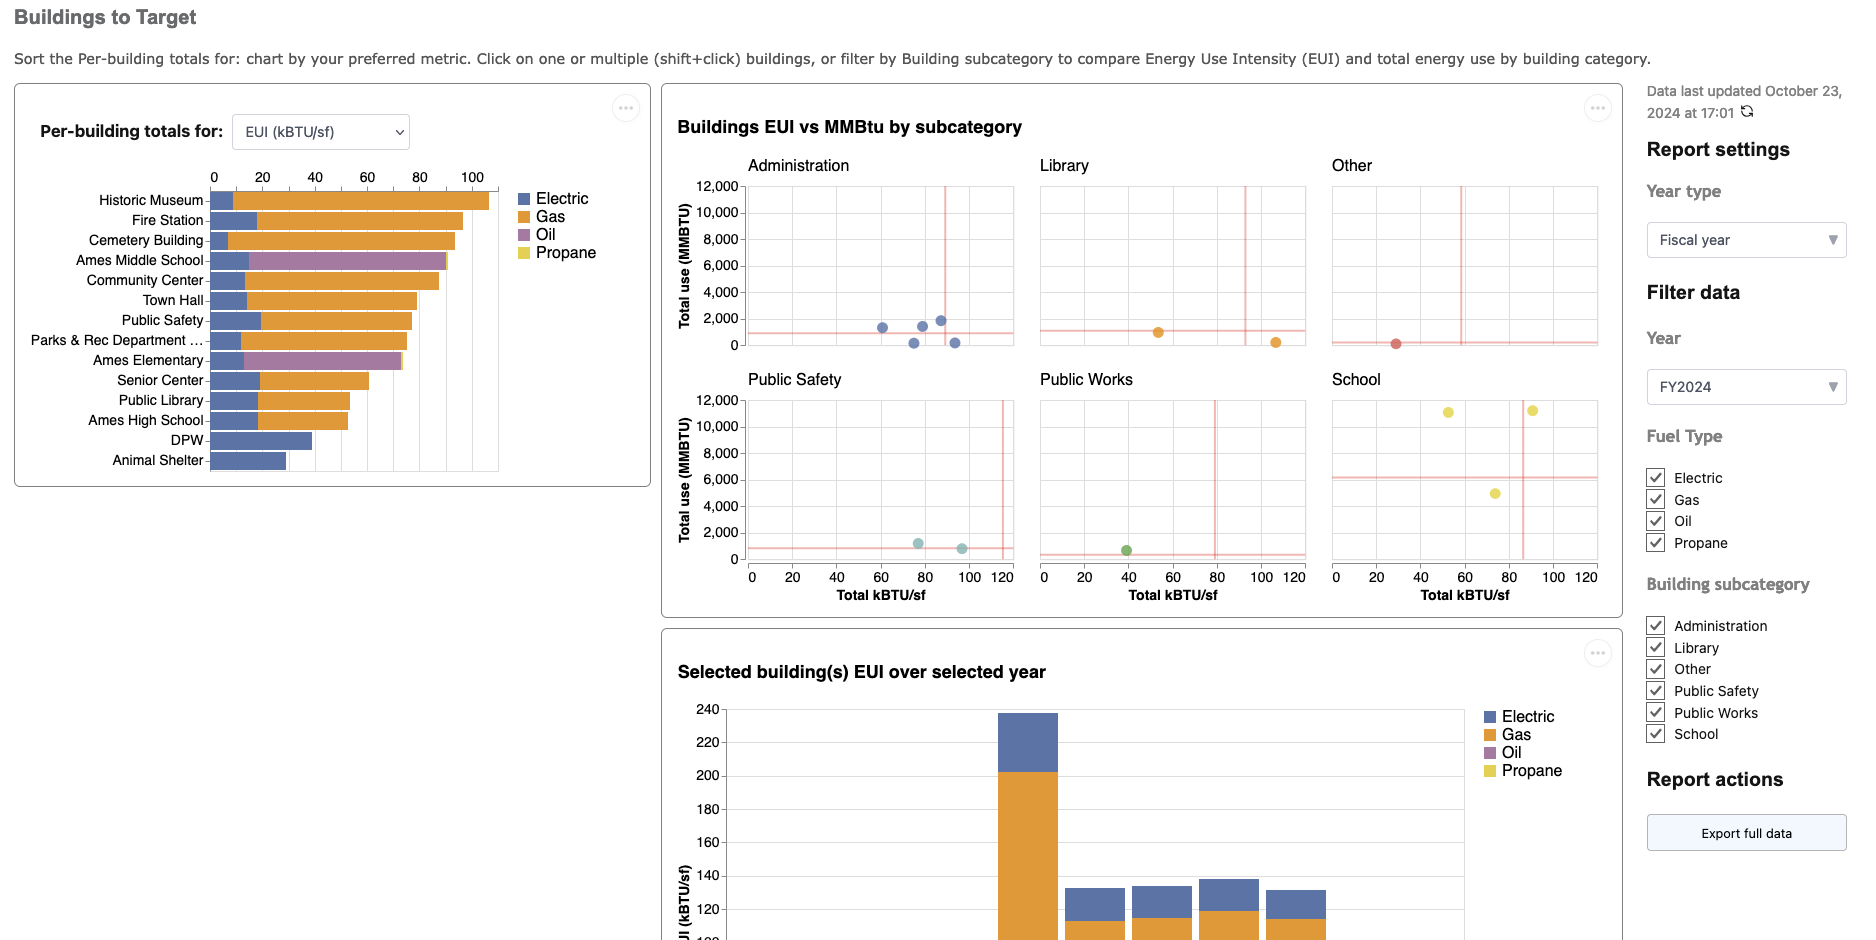
Page that helps identify high-usage buildings

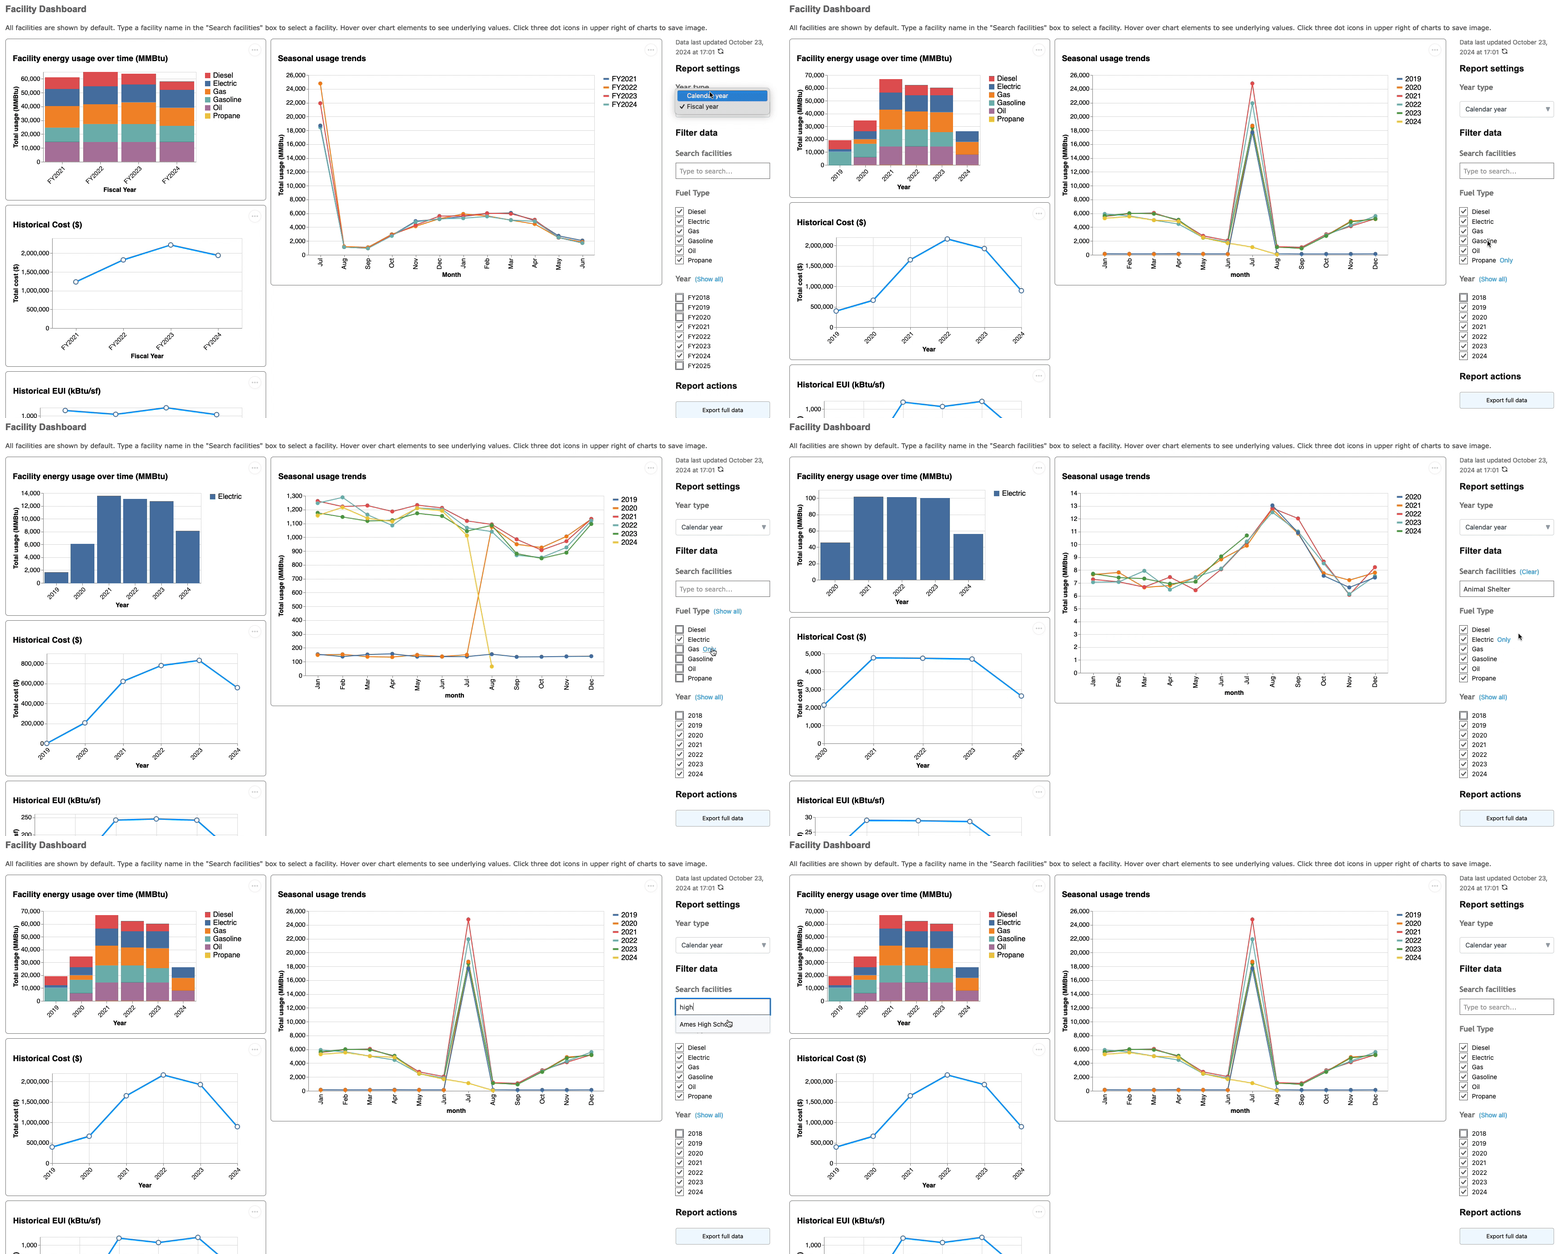
Animation showing instantaneous data filtering and redrawing

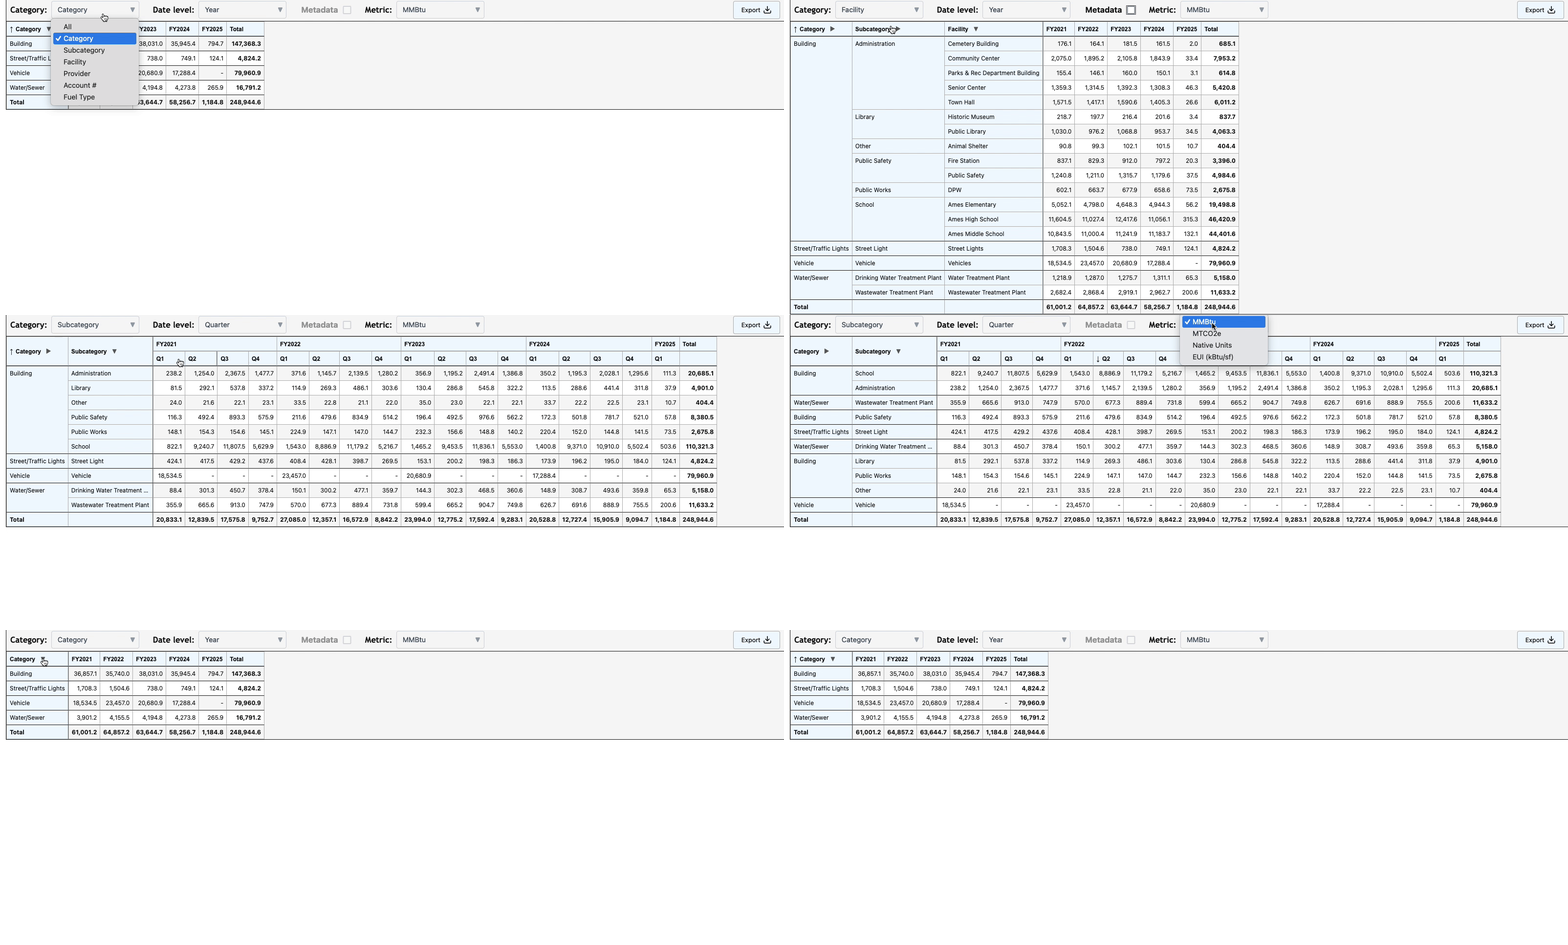
Pivot table that aggregates data on-the-fly
